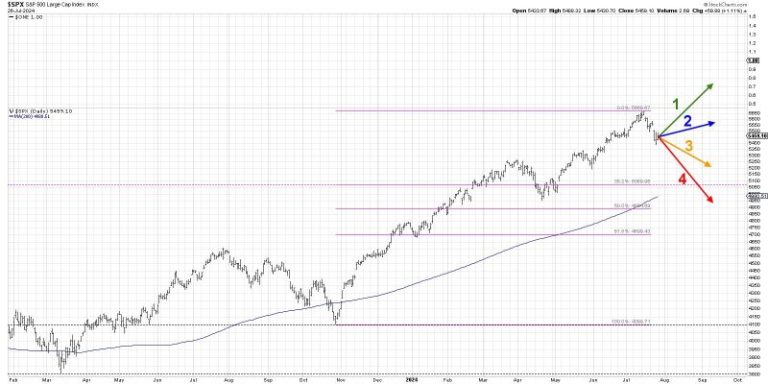
This week saw the major equity averages continue a confirmed pullback phase, with some of the biggest gainers in the first half of 2024 logging some major losses. Is this one of the most buyable dips of the year? Or is this just the beginning of a protracted decline with…
Last week, there was a noticeable change in investor sentiment. We have so much data coming out this week,…
The S&P 500 index ($SPX) is a capitalization-weighted stock index. Many lesser capitalization blue-chip stocks that compose these 500…
Good morning, and welcome to this week’s Flight Path. Equities had another tough week last week, and we saw…
This week saw the major equity averages continue a confirmed pullback phase, with some of the biggest gainers in…
This week we have four Magnificent Seven stocks reporting earnings. We also take a look at McDonalds (MCD) and…
In this edition of StockCharts TV‘s The Final Bar, Dave previews earnings releases from TSLA and GOOGL, breaks down key levels…
In this edition of StockCharts TV‘s The Final Bar, Dave previews earnings releases from TSLA and GOOGL, breaks down key levels…
This week saw the major equity averages continue a confirmed pullback phase, with some of the biggest gainers in…

