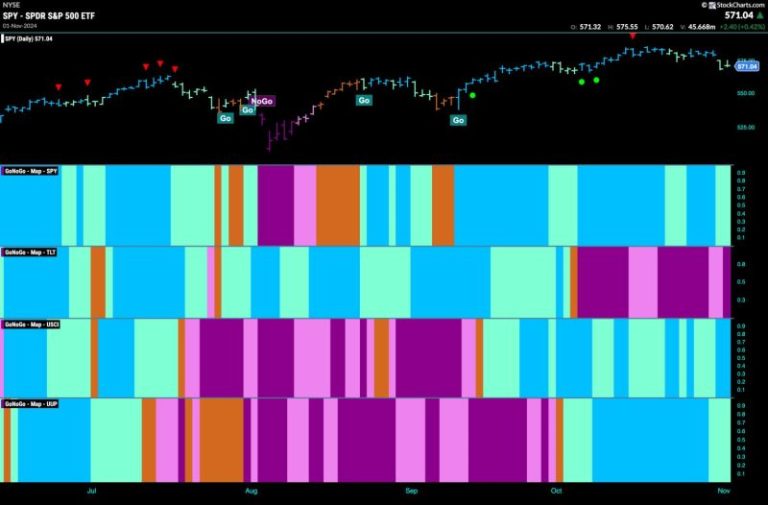
Good morning and welcome to this week’s Flight Path. Equities saw the “Go” trend remain in place this week but we saw weakness with a few aqua bars. GoNoGo Trend shows that the “NoGo” trend strengthened at the end of the week in treasury bond prices. U.S. commodities hung on to the…
In this video from StockCharts TV, Julius begins by looking back at the completed monthly bars for October to…
In this StockCharts TV video, Mary Ellen reviews the negative price action in the broader markets while highlighting pockets of…
In this video from StockCharts TV, Julius begins by looking back at the completed monthly bars for October to…
In this StockCharts TV video, Mary Ellen reviews the negative price action in the broader markets while highlighting pockets of…
The Nifty largely consolidated over the past five sessions but did so with a bearish undertone. The Nifty traded…
With the Magnificent 7 stocks struggling to hold up through a tumultuous earnings season, what sort of opportunities are…
We noticed on Thursday evening how poor the internals were for the SPY, based on Price Momentum Oscillator (PMO)…
Following the recent market fluctuations, with a sharp decline and a subsequent rally, it’s crucial to examine these movements’…

